Report data
on a map,
with boundaries.
See your Salesforce records in geographic context, on a map with boundary overlays (council districts, school boundaries, voting precincts), then take action based on geography. Click or draw to get record IDs inside, outside, or near an area, and send them straight into a Flow.
Why this is here. I created this solution after hearing a few clients express a need to locate their work in relationship to specific local or national boundaries. Many of the other mapping solutions available were either too complex, too expensive, or didn't provide the custom layers my clients needed.
Nonprofits need to know where their constituents, sites, and programs sit in the world, and then act on those groups. External Map with Report gives you a single embeddable map inside Salesforce: your report rows become markers, boundary layers (districts, parks, service areas) overlay the map, and when you click a boundary or draw a polygon, you get back the record IDs that fall inside, outside, or near that area. Send those IDs into a Salesforce Flow and you decide what happens next: add to campaign, assign to field staff, trigger outreach, or run any process you design.
Your reports, on a map
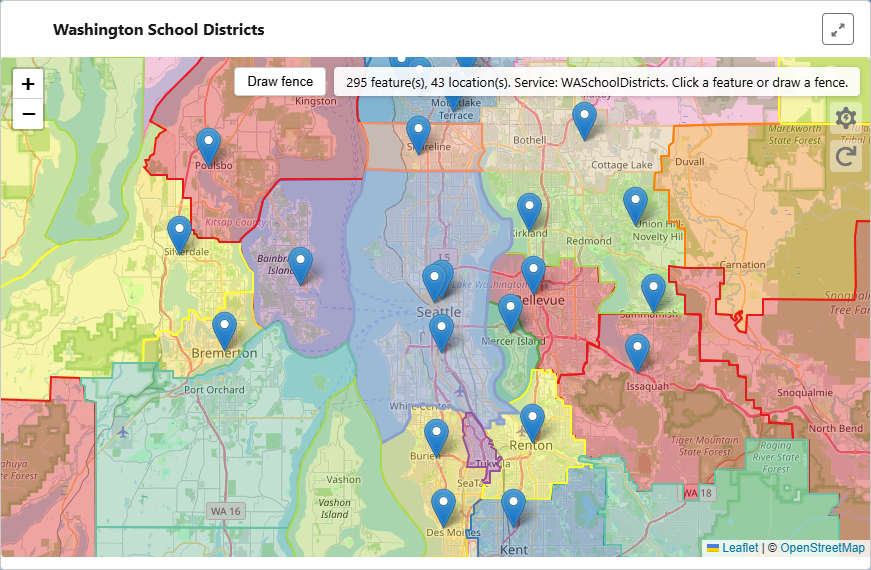
You already have Salesforce reports with location data, latitude/longitude, or addresses that can be geocoded. External Map with Report takes a report you choose and plots each row as a marker on an interactive map that lives right inside Lightning (App, Home, or Record pages).
The map itself is powered by an external GIS service (e.g. a secure map app). That same service can supply boundary overlays (council districts, school districts, service areas) so your team can see not only where records are, but which boundaries they fall inside.
Where it runs
- ✓ Lightning App pages
- ✓ Home pages
- ✓ Record pages
Good fit for
- Program staff viewing sites or clients on a map
- Seeing which district or region a record falls in
- Planning and territory views
- Any report with lat/lng or address data
1. Configure
Point the component at a Salesforce Report and map which columns hold locations (custom latitude/longitude or native address fields). Optional columns drive marker labels and popups. Then choose boundary overlay service: council districts, school districts, voting precincts, service areas, parks, and the like.
2. View
Report rows appear as markers on the same map as your overlay. Users can pan, zoom, go full-screen.
3. Take action
After a click or drawn selection, the map classifies records as inside, outside, or near the area. Click Send to Flow and those record IDs (and counts) are sent to your selected Flow as inputs—you design what happens next: campaigns, assignments, tasks, updates, or any automation you already trust.
See your data on the map
GeoJSON overlay. Configurable boundary layers (e.g. council districts, school districts, voting precincts, service areas) with token-based auth and radius-based fetch so you only load what you need.
Custom markers. Your report rows (with lat/lng or geocoded addresses) are sent to the map and plotted as markers. Optional record IDs per location so the map can return exactly which records you select.
Mission use
Answer questions like: Which district is this constituent in? Is this site inside a National Park or service boundary? Which school or council area does this address belong to?
Select by geography
Overlay feature click. Click a polygon on the map (e.g. a council district). The service runs point-in-polygon over your markers and classifies each record as inside that boundary, outside, or near it.
Draw a fence. Use the drawing tool to sketch your own polygon on the map. Apply runs the same classification: which of your records fall inside, outside, or within a configurable distance of the shape you drew.
Mission use
Define a program area or territory by drawing it, or select everyone in an existing boundary with one click. No more exporting to spreadsheets or guessing who's in scope.
IN, OUTSIDE, and NEAR
Every selection returns three groups: IN (records inside the polygon), OUTSIDE (everyone else), and NEAR (records that sit just outside the boundary but within a configurable distance, e.g. a few miles). That "near" bucket is ideal for outreach at the edges of a district or service area.
Mission use
Prioritize people inside a boundary for a campaign, then follow up with "near" contacts. Or exclude anyone outside a service area while still seeing who's close for future expansion.
Take action with Flow
A Send to Flow opens a Salesforce Flow and passes inIds, outIds, and nearIds (and counts) as Flow input variables.
You design the Flow. That might mean: add selected records to a campaign, assign to a field rep, create tasks, send emails, update a field, or run any other process. The map handles geography; Flow handles the rest of your mission logic.
Mission use
One click from "these are the records in this district" to "add them to our outreach campaign" or "assign to this staff member." No manual list building or copy-paste.
Constituent outreach by district
See which contacts fall in which voting or council district; click the district and send those IDs to a Flow that adds them to a campaign or assigns follow-up.
Program coverage by region
Draw or select a service area and see which sites or clients are inside, outside, or near. Use Flow to update regions, assign field staff, or trigger reporting.
Site eligibility
Check whether locations fall inside a park, school boundary, or other zone. Classify as in/out/near and run eligibility or compliance logic in Flow.
Reporting by geography
Answer board or funder questions: "How many constituents in District X?" or "Which sites are in this boundary?", select on the map, get counts and IDs, feed into reports or Flows.
Bulk actions after selection
Once you have IN/OUT/NEAR record IDs, your Flow can do anything: change owner, add to campaign, create activities, update fields, or trigger integrations. You define the action.
Planning and territory view
Visualize where your data sits relative to real-world boundaries. Draw proposed service areas and see who's in scope before committing, then send to Flow when ready.
Interested in mapping your report data?
This component is part of my Salesforce development practice. If you have report data and a need to see it on a map with boundary layers, get in touch and I can talk through your use case and whether this (or a custom variant) fits.
Schedule a Call